
Virtual Dyno


 07-04-2012, 02:03 PM
#122

OK, as per hornetball's advice I changed the time to read in seconds, and then changed the header of that column to read "Time (s)" instead of "Timestamp (us)" (based on what I see in a csv that triple88a posted earlier in the thread). Still not right I'd guess, as it's showing me at >350hp when my airflow is only peaking at 23-24lb/min.
Any other suggestions to make this work? Getting closer...
Any other suggestions to make this work? Getting closer...

Reply
 0
0

0
07-04-2012, 04:13 PM
#124
Hey Matt, plotted your data. Dynojet plot attached (used 3rd gear, stock wheel height and swagged weights at 2250# for car and 170# for driver). It looks pretty reasonable, but the curve gets wacky above 6500 or so. Makes me wonder if your clutch is slipping, although I'll occasionally get something similar at the end of a run -- probably some kind of VD trimming issue at the end of the data. Obviously, the stuff from 6500-on isn't real, but the rest of the curve is. Looks like ~220RWHP. Nice!
Reply
0
0
 07-04-2012, 05:02 PM
#127
Once you cut the bad portion from the log you get a good graph up until the revlimiter starts affecting stuff.
On the file I attached i cut that portion out and adjusted the time so you get a correct dyno.
Reply
0
0
07-04-2012, 05:28 PM
#130
Damn you guys are faster than me haha...just did the same thing, trimmed the logfile and got the same results on the graph. And yeah hornetball, after getting my AFRs in line I started adding timing...will revisit that in the near future and keep bumping it up.
1.6, stock 5 speed and rear end; 3rd gear run in that file.
Thanks for plugging all that in…pretty much nailed the weights, too. How did you get the boost to show up in the lower graph?
Here’s a shot of the pull in ECMLink:
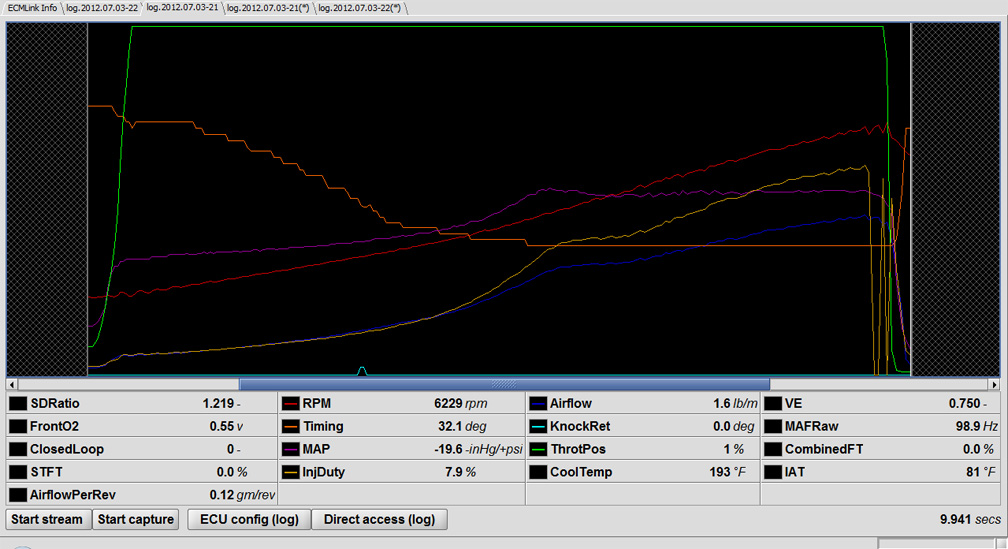
Hey Matt, plotted your data. Dynojet plot attached (used 3rd gear, stock wheel height and swagged weights at 2250# for car and 170# for driver). It looks pretty reasonable, but the curve gets wacky above 6500 or so. Makes me wonder if your clutch is slipping, although I'll occasionally get something similar at the end of a run -- probably some kind of VD trimming issue at the end of the data. Obviously, the stuff from 6500-on isn't real, but the rest of the curve is. Looks like ~220RWHP. Nice!
Here’s a shot of the pull in ECMLink:
Last edited by matthewdesigns; 07-04-2012 at 08:46 PM.
Reply
0
0
07-05-2012, 01:07 AM
#132
Thanks Rick. And I can't yet log AFRs...need an input buffer for my ecu. But that's coming up sooner than later, and I'll be able to further refine them at that point as well. At the moment they are safe but not quite as smooth as I'd like. And after I found that my wastegate was loose last month I shimmed the ---- out of it, probably accounting for some of that boost spike. I may back it down a little and see if that helps smooth out the curve.
Reply
0
0
 07-21-2012, 01:44 AM
#134
Elite Member
iTrader: (13)

Join Date: Dec 2006
Location: Taos, New mexico
Posts: 6,804
Total Cats: 647
Hey guys, I've been trying to get this to work and for the life of me can't figure out what I'm missing. MS1 mspnp log, 3rd gear pull, once i can get it to work i'm going to work on getting some better pulls. As you can see my boost control sucks.
It gives the following error when I try to plot it:
"E101: Not all columns needed for calculations found.
REQUIRED COLUMNS: Time, RPM, Throttle Position
If your log does not contain these, the developer does not need your log."
Its a regular ms1 log which contains all of the above.
Please help me plot this and let me know what I need to do for future plots.
Reply
0
0
07-21-2012, 01:43 PM
#137
Elite Member
iTrader: (13)
Join Date: Dec 2006
Location: Taos, New mexico
Posts: 6,804
Total Cats: 647
You may be right. I've noticed that before, what the hell does that mean? Literally the TPS is a jagged line across the log when viewed in MLV. Screenshot for easier reference.
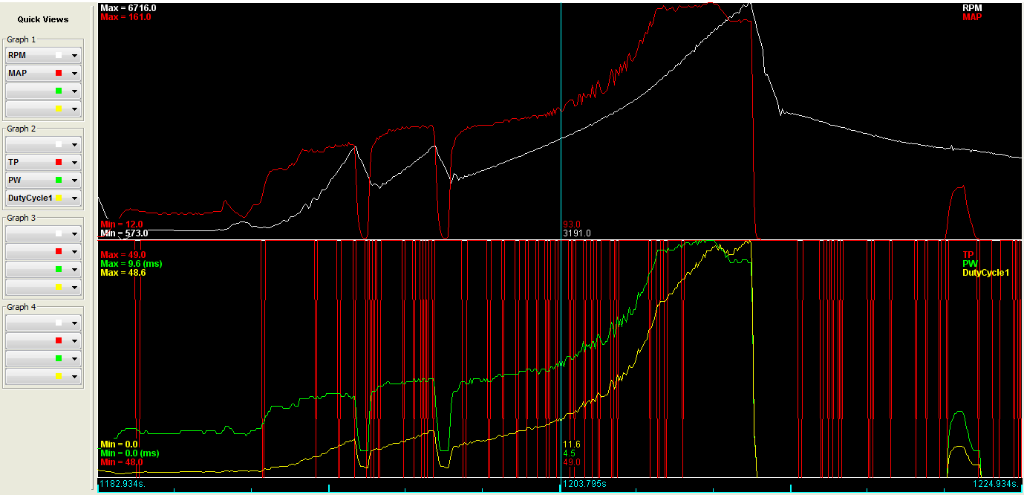
I know I need to upgrade from my crappy 1990 TPS (on/off switch) to a variable TPS sensor, but is this part of my trouble when i go to graph out my log?
I know I need to upgrade from my crappy 1990 TPS (on/off switch) to a variable TPS sensor, but is this part of my trouble when i go to graph out my log?
Reply
0
0


