How to find your injector dead time
 03-28-2013, 01:37 AM
#81
Junior Member


Join Date: Aug 2009
Location: Lake Jackson, TX
Posts: 166
Total Cats: 7
 slow. I can probably idle them higher, but 12 seemed very stable and I want to get the rest of the tune sorted out before trying to push the minimum limits of these injectors. (That just sounds idiotic for such comparatively small injectors.)
Last edited by jnshk; 03-28-2013 at 01:39 AM. Reason: Why did the body of my message suddenly vanish?

Reply
 0
0

0


 02-09-2014, 08:22 PM
#85
Senior Member

Join Date: Dec 2004
Location: Brisbane, Australia
Posts: 1,278
Total Cats: 37
Those are very similar numbers to what I measured with my ID725s. Quite different to the published specs!
Do you think our cars potentially have a lower voltage at the injectors than at the ECU?
If I use the published specs for the injector then the VE table ramps up rapidly in the low load rows of the table, using the measured value flattens it out nicely but then seems to be pig rich for some overrun conditions.
Any ideas?
Reply
0
0
07-21-2014, 04:34 PM
#86

Bummer, looks like your injectors have 2 distinct slopes. A shallower one, with an effective dead time of ~1.5 ms (eyeballing it), at smaller PW's, and a steeper one starting at about 1.85 ms of electrical pulse width, with about 0.9 ms effective dead time.
For idle stability I'd use the 1.5 ms number. This would mean the VE table entries in the range of 2-2.5 ms would need adjusting.
I saw a paper out there that describes how OEs program a dual-slope deadtime like this. It's actually described in some OE injector datasheets.
For idle stability I'd use the 1.5 ms number. This would mean the VE table entries in the range of 2-2.5 ms would need adjusting.
I saw a paper out there that describes how OEs program a dual-slope deadtime like this. It's actually described in some OE injector datasheets.
All injectors will have a non-linear and linear operating range. The non-linear range is in the lower pulse-widths and tends to be where the low slope's line is generated from that data range.
Last edited by LowFlyin'; 07-22-2014 at 10:54 AM. Reason: brake point? lol
Reply
0
0
07-22-2014, 10:45 AM
#87
Elite Member
Thread Starter

Join Date: Jul 2005
Posts: 6,420
Total Cats: 84
One very common mistake is that because often the latency spec given by manufacturers for a given fuel pressure is for the injectors squirting in to test tubes with the injector outlet at atmospheric pressures. Because latency is most important at idle, at which the nozzles see ~35 kPa (- 10 psi), you should look up the latency at:
your fuel pressure + 10 psi
your fuel pressure + 10 psi
Reply
0
0
07-25-2014, 12:46 AM
#88
Senior Member
iTrader: (2)

Join Date: Oct 2013
Location: Goleta, Southern California
Posts: 520
Total Cats: 27
How about this?
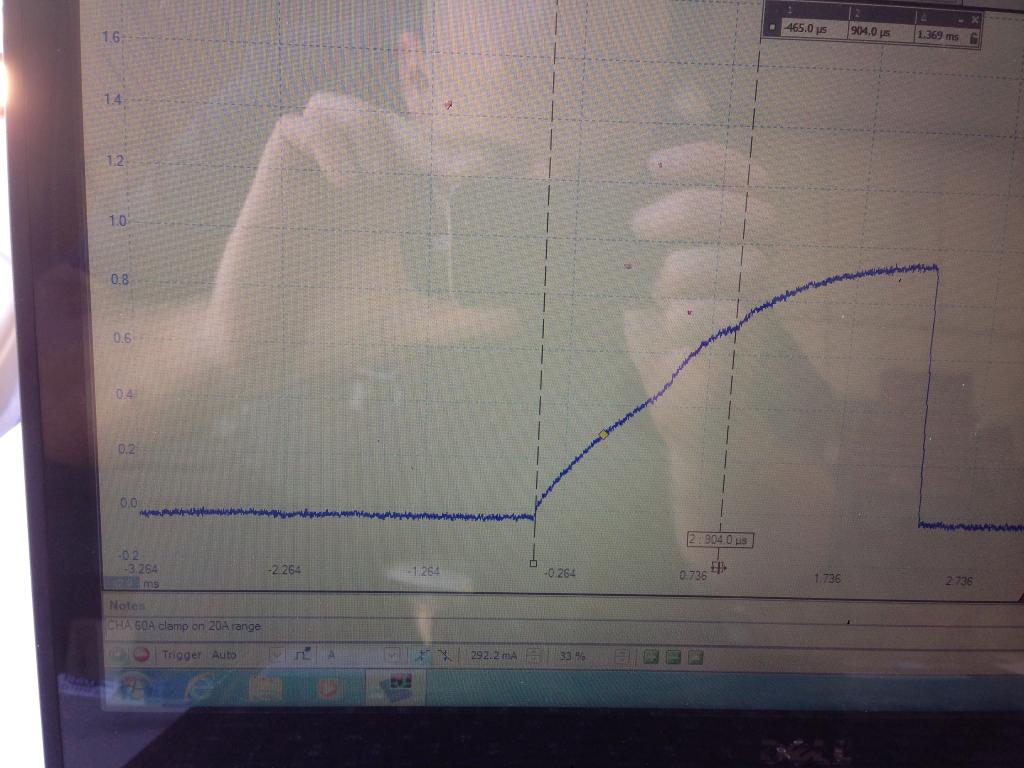
I'm sure most that have access to a scope know this but if you didn't, here you go.
This is a Pico scope hooked to an injector wire using a low amp current probe.
You see zero current on the left and then when the injector is switched on it begins to ramp up. I placed the first marker here.
Notice the bump in the ramp. This is where the pintle moves and changes the flow of current slightly.
The straight down drop is when the injector is turned off.
The box in the top of the screen is showing where I placed the markers. The first marker to the second is 1.389 ms. I am unclear on if the first "dip" or the second (which I have marked) is actual dead time. Could be some where in between? I highly doubt the injector is flowing "fully" at the first dip as the pintle has just begun to move.
Total "on time" here is about 2.8ms. (Idle)
This is just a stock 265cc/hr 1.8L injector at stock fuel pressure.
I know everyone doesn't have a oscilloscope at their disposal, but if you do, check it out. I wonder how this compairs to the other method described in this thread.

Reply
0
0
07-25-2014, 11:14 AM
#89
When we were including latency data with our injector, the method above is how it was collected.
Oscilloscope, direct trigger, pressure. Read the graphed data and average 10 results.
We've stepped away from just providing latency data as many of the current ECU's are asking for more injector data.
Oscilloscope, direct trigger, pressure. Read the graphed data and average 10 results.
We've stepped away from just providing latency data as many of the current ECU's are asking for more injector data.
Reply
0
0
07-25-2014, 09:49 PM
#90
Senior Member
iTrader: (2)
Join Date: Oct 2013
Location: Goleta, Southern California
Posts: 520
Total Cats: 27
When we were including latency data with our injector, the method above is how it was collected.
Oscilloscope, direct trigger, pressure. Read the graphed data and average 10 results.
We've stepped away from just providing latency data as many of the current ECU's are asking for more injector data.
Oscilloscope, direct trigger, pressure. Read the graphed data and average 10 results.
We've stepped away from just providing latency data as many of the current ECU's are asking for more injector data.
Just seems that 1.3ms is a little slow, but hey, they're stock.
Reply
0
0
08-27-2014, 09:48 AM
#91
Junior Member

Join Date: Mar 2011
Location: Eindhoven, The netherlands
Posts: 197
Total Cats: 19
I tried several things and i really dont get it.. here is my datalog, first i did a little run to warm the car up and then i did the trick in megasquirt with the pw ms up and down
Is my datalog clean to perform this trick
My injectors are the yellow RX-8 injectors
Is my datalog clean to perform this trick
My injectors are the yellow RX-8 injectors
Reply
0
0
05-16-2020, 11:07 PM
#92
Newb

Join Date: Apr 2020
Location: Sakhalin Island
Posts: 8
Total Cats: 0
Procedure:
Idle car while datalogging, and have a means of changing injector electrical pulse width slowly up and down while logging. Car must have a reasonably stable idle at a fairly fixed RPM, and battery voltage must be constant throughout.
Log MAP, AFR, Battery volts, and Injector electrical pulse width, while idling. Slowly raise and lower injector on time (I did it by changing the AEM's injector dead time vs. battery voltage, across 3 cells, straddling the battery voltage that I was seeing). Slowly raise and lower it until the RPM starts to drop significantly or the car starts to misfire. I could go from 11:1 to 16.3:1 or so and back. Do this several times, it may take you a few minutes.
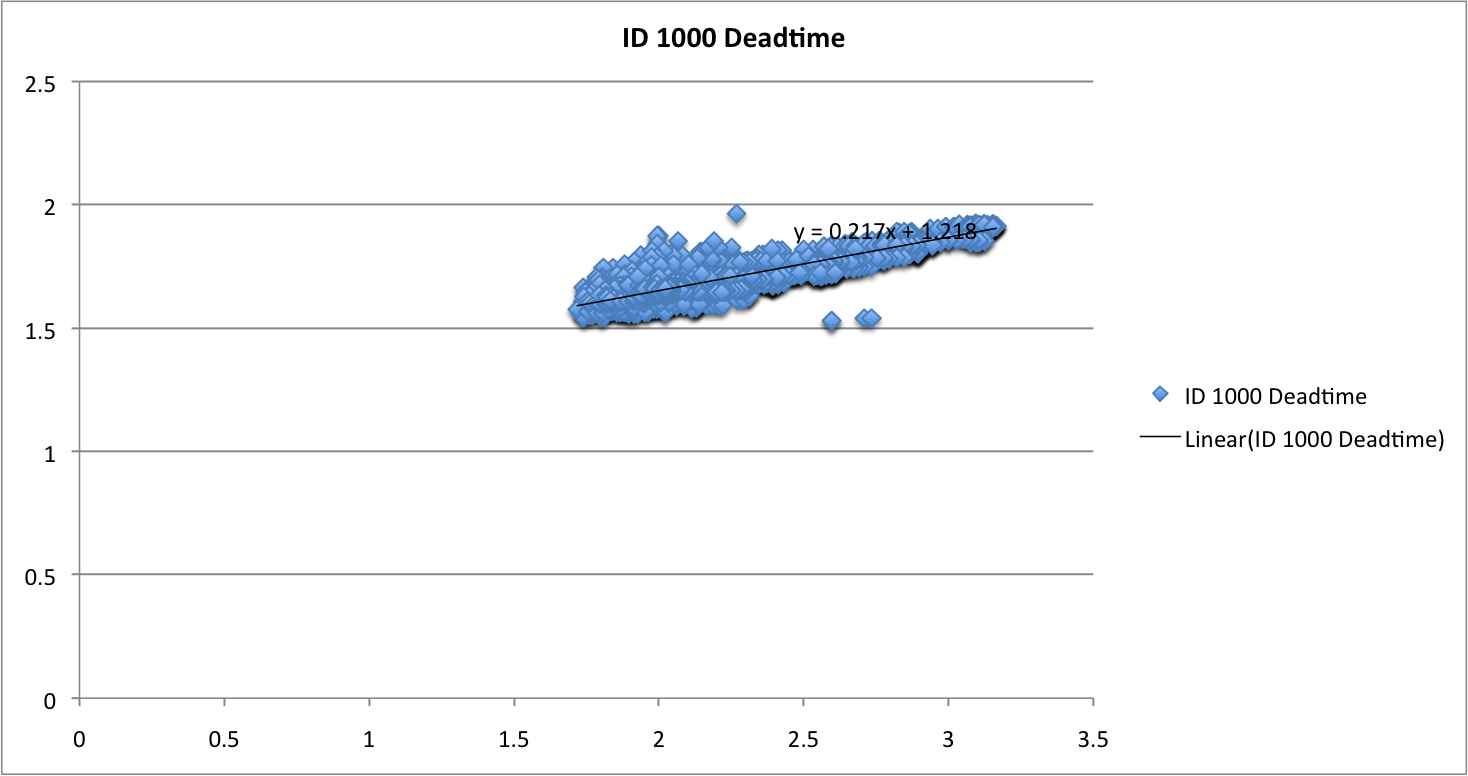
Then examine the datalogs. Do an XY plot. Plot MAP divider AFR on the X-axis, then injector on-time on the Y-axis. You can use AEMLog for this, or MS Excel. Excel has the advantage of having a linear curve fit ("trendline, linear"). The datapoints should form a line. If you project this line to the Y-axis, the intercept is the dead time. See attached.
Idle car while datalogging, and have a means of changing injector electrical pulse width slowly up and down while logging. Car must have a reasonably stable idle at a fairly fixed RPM, and battery voltage must be constant throughout.
Log MAP, AFR, Battery volts, and Injector electrical pulse width, while idling. Slowly raise and lower injector on time (I did it by changing the AEM's injector dead time vs. battery voltage, across 3 cells, straddling the battery voltage that I was seeing). Slowly raise and lower it until the RPM starts to drop significantly or the car starts to misfire. I could go from 11:1 to 16.3:1 or so and back. Do this several times, it may take you a few minutes.
Then examine the datalogs. Do an XY plot. Plot MAP divider AFR on the X-axis, then injector on-time on the Y-axis. You can use AEMLog for this, or MS Excel. Excel has the advantage of having a linear curve fit ("trendline, linear"). The datapoints should form a line. If you project this line to the Y-axis, the intercept is the dead time. See attached.
I have to change the pulse width. What should I do to change it?
afr target from 11 to 16?
Reply
0
0

Thread
Thread Starter
Forum
Replies
Last Post


