158.32whp/157.2tq @ 8psi
 08-18-2007, 04:16 PM
#1
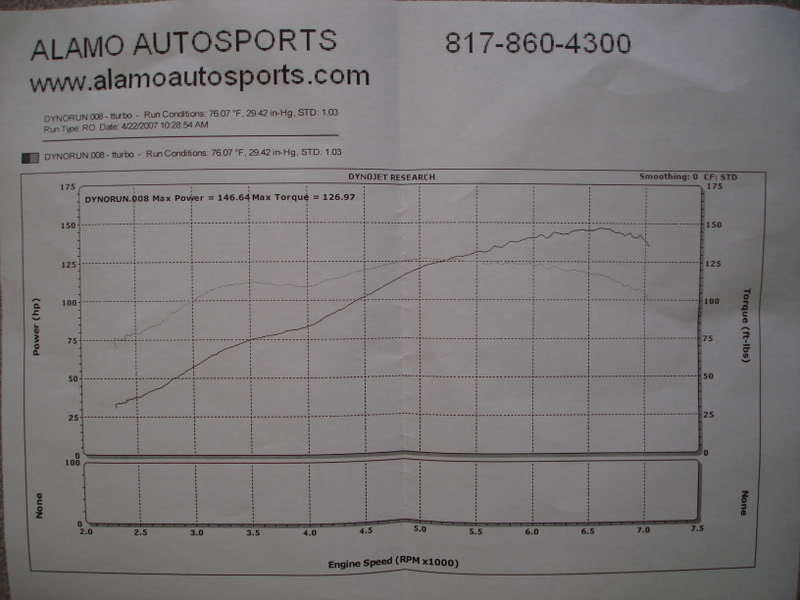
My previous pull running 6psi that I posted in a previous thread.
My new dyno graph done today. Only changes are the FMIC and 8psi.
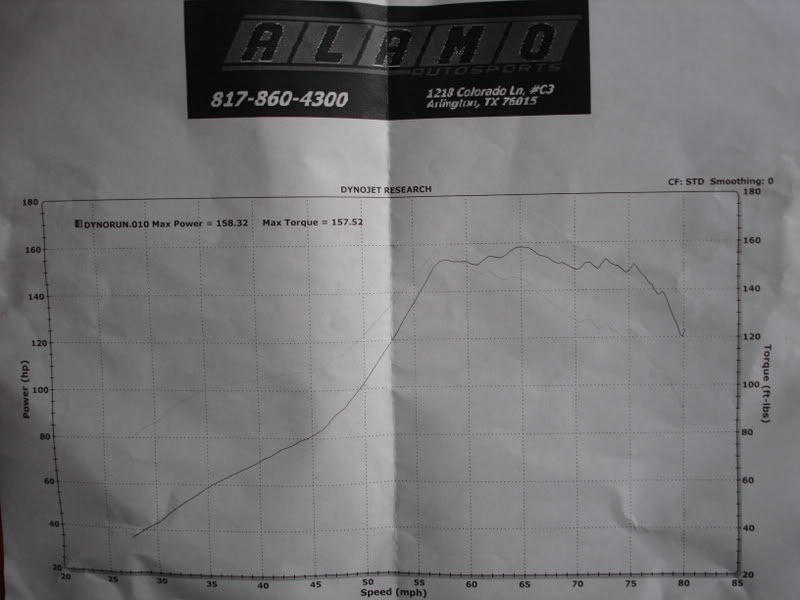
It would have made good power if I didn't have the over-fueling issue. The tq curve is hard to see, but it hits peak tq where the whp curve flattens out. I have the 8:1 and 6:1 discs for the Vortech and hopefully will do some "tuning" today to get rid of that.
My new dyno graph done today. Only changes are the FMIC and 8psi.
It would have made good power if I didn't have the over-fueling issue. The tq curve is hard to see, but it hits peak tq where the whp curve flattens out. I have the 8:1 and 6:1 discs for the Vortech and hopefully will do some "tuning" today to get rid of that.

Reply
 0
0

0
 08-19-2007, 08:44 PM
#7
teh boost gauge shows stead boost from 4100 till redline. I put in the new disk and I can tell it pulls longer, but still has the flat spot on top. It used to do it around 5k-5.5k, where you can feel it stop pulling hard, and now it goes to around 6k. I won't get another chance to dyno till I get the Haltech, so that's all I have to go on till I do the jump to "way too fast".
Reply
0
0
08-20-2007, 08:24 AM
#8
Boost Czar


iTrader: (62)
Join Date: May 2005
Location: Chantilly, VA
Posts: 79,688
Total Cats: 4,113
I bet if you logged your boost against RPM you'd be surprised....look at your first plot on how well it handled the boost....there is not a significant torque drop, and as a result to HP increases to redline.
On your second plot, only running 2 more psi in the intake manifold, your torque drops below 100 at 7000RPM....less than the previous results.
I don't need to watch your gauge to tell you that your boost is spiking and droping. You can see it in the torque curve....it spikes and then drops like crazy....mathematically, if your turbo maintained the boost pressure to redline, then the curve of the TQ/HP would look very similar to your previous plot, only up the axis a bit. And as a reuslt of the boost drop, instead of making your peak torque and holding it untill 6K, it drops off instantly, and your HP fails to rise as it should.
Let's say your torque only dropped around 25tq from the peak at redline, as it should, then your HP would actually be 175 at 7000RPM.
Just think about it, you increased your peak torque by 31TQ with 2psi, however, your peak HP only increased 12HP......something about that doesnt seem odd to you?
Reply
0
0
08-20-2007, 09:01 AM
#9
Supporting Vendor

iTrader: (33)
Join Date: Jul 2006
Location: atlanta-ish
Posts: 12,659
Total Cats: 134
You're ******* dense dude. Boost spike and droop, no question. If you work at a shop, then you should know that your mechanical boost gauge sucks *****, and you should have hooked up the dyno's sensors to capture telemetry. How many seconds does it take to add the MAP/Temp sensor so you can plot accurate data?
Here's a couple of my own graphs. "dotted" plot represents manual boost control, spike and droop. Looks like your plot doesn't it? Just higher up.
Solid plot represents EBC helping with the shitty wastegate actuator. Which is what Brainy is trying to explain to you.

I don't remember any of the numbers anymore, but the MBC graph was something stupid like 16psi spike falling to 10psi or something. The solid graph is 14psi falling to 13psi.
Here's a couple of my own graphs. "dotted" plot represents manual boost control, spike and droop. Looks like your plot doesn't it? Just higher up.
Solid plot represents EBC helping with the shitty wastegate actuator. Which is what Brainy is trying to explain to you.
I don't remember any of the numbers anymore, but the MBC graph was something stupid like 16psi spike falling to 10psi or something. The solid graph is 14psi falling to 13psi.

Reply
0
0
08-20-2007, 03:28 PM
#10
You're ******* dense dude. Boost spike and droop, no question. If you work at a shop, then you should know that your mechanical boost gauge sucks *****, and you should have hooked up the dyno's sensors to capture telemetry. How many seconds does it take to add the MAP/Temp sensor so you can plot accurate data?
Here's a couple of my own graphs. "dotted" plot represents manual boost control, spike and droop. Looks like your plot doesn't it? Just higher up.
Solid plot represents EBC helping with the shitty wastegate actuator. Which is what Brainy is trying to explain to you.
I don't remember any of the numbers anymore, but the MBC graph was something stupid like 16psi spike falling to 10psi or something. The solid graph is 14psi falling to 13psi.
Wow. That does look alot like mine. I might be wrong. I'll get Brice to look at it when he gets back this week. Then we can fix it and I'll have a new plot (hopefully).
Reply
0
0

 08-29-2007, 05:51 PM
#18
Well, did a little tweaking this week. After a few 2d gears pulls to redline I did notice it was dropping to 5.5psi at redline. It would do fine unless you went WOT, where it would hit 8psi and then immediately start falling to WG spring pressure by redline.
I decided to do a "helper spring", so I went to Lowe's and bought 6 different spring rates and went to work. They did ZERO to fix the problem. All I got was higher max boost and it would still fall to 5.5psi @ redline. After wasting 3 days trying to get that to work, I installed my Begi. That was last night, and now I get a peak to about 9psi, holds steady at 8psi to redline. I now have alot of springs I do not need and alot of wasted time trying to make them work.
On a good note, my A/F sits between 11:1 - 10:1 under boost till 6psi, where it drops to 13:1 - 14:1 area for a split second, then moves between 12:1 and 10:1. That drop in A/F is where the AFPR starts to fall off and the Inj Controller kicks in. I am working on tuning that drop out with the Begi, but I have only been tweaking it since last night.
Cliff Notes: OVERFUELING caused boost loss, helper spring did NOTHING. Begi was the fix.
Reply
0
0

Thread
Thread Starter
Forum
Replies
Last Post


